Correlational Research Methods
How do psychologists measure relationships between variables while avoiding causal overclaims?
The Core Idea
Correlation measures the relationship between two variables. It tells whether variables change together, how strongly they relate, and in what direction.
The AP exam is relentless about this: correlation can predict, but correlation alone does not show that one variable caused the other.
Correlation Coefficient
A correlation coefficient ranges from -1.00 to +1.00. The sign shows direction. The distance from 0 shows strength.
| Coefficient | Direction | Strength | Plain Meaning |
|---|---|---|---|
| +0.90 | Positive. | Strong. | As one variable increases, the other tends to increase. |
| +0.20 | Positive. | Weak. | Variables move together slightly. |
| 0.00 | None. | No linear relationship. | Knowing one does not help predict the other linearly. |
| -0.30 | Negative. | Weak. | As one increases, the other tends to decrease slightly. |
| -0.85 | Negative. | Strong. | Higher scores on one variable predict lower scores on the other. |
Positive, Negative, and Zero
| Relationship | Pattern | Example | Do Not Say |
|---|---|---|---|
| Positive correlation | Variables move in the same direction. | More study time relates to higher quiz scores. | Study time definitely caused the scores. |
| Negative correlation | Variables move in opposite directions. | More absences relate to lower grades. | Absences are the only cause of grades. |
| Zero correlation | No clear linear relationship. | Shoe size does not predict vocabulary score. | The variables are important just because they were measured. |
Scatterplot Reading
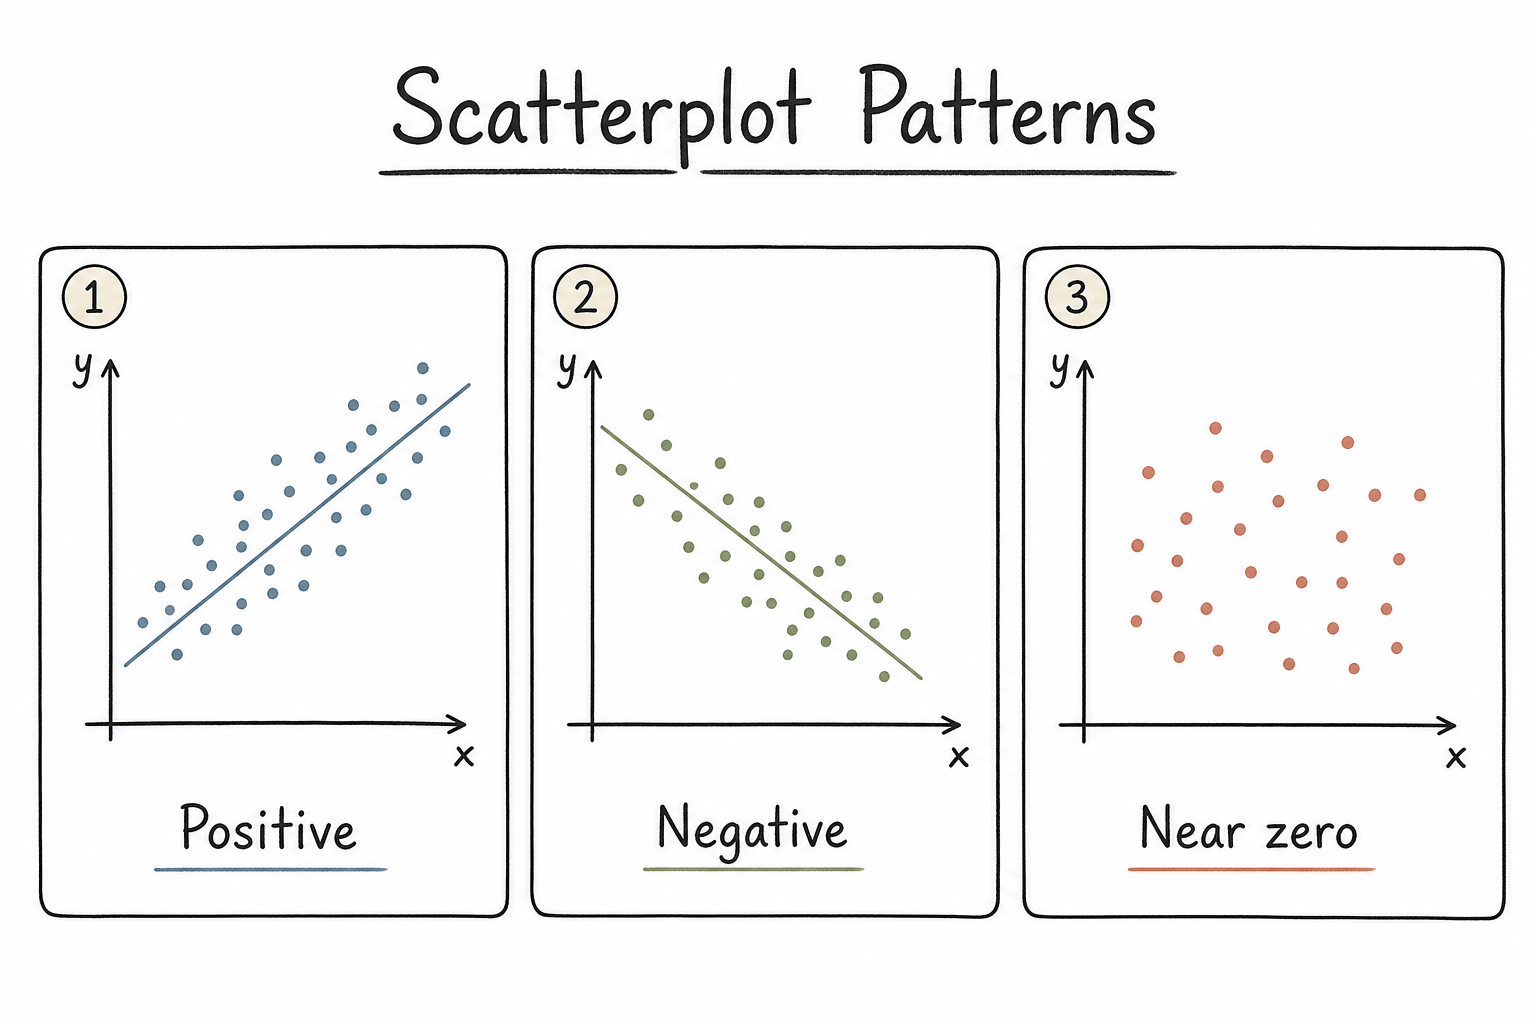
A scatterplot shows each participant or case as a point. The overall cloud of points shows relationship direction and strength.
| Point Cloud Looks Like... | Interpretation | Correlation Clue |
|---|---|---|
| Rises left to right. | Positive relationship. | r is positive. |
| Falls left to right. | Negative relationship. | r is negative. |
| Tight line-like cloud. | Strong relationship. | r is close to +1 or -1. |
| Loose scattered cloud. | Weak relationship. | r is close to 0. |
| Random blob. | No clear linear relationship. | r near 0. |
Prediction without Causation
Correlation can help prediction. If two variables are strongly related, knowing one may help estimate the other. That still does not identify the cause.
| Correlational Finding | Allowed Conclusion | Not Allowed |
|---|---|---|
| Sleep hours and memory score are positively correlated. | Sleep hours predict memory scores in this sample. | Sleep caused better memory. |
| Stress and sleep quality are negatively correlated. | Higher stress is associated with lower sleep quality. | Stress definitely caused poor sleep. |
| Practice time and performance are strongly related. | Practice time can help predict performance. | Practice is the only possible cause. |
Directionality and Third Variable
Two major problems block causal conclusions from correlation.
| Problem | Meaning | Example |
|---|---|---|
| Directionality problem | Cannot tell which variable causes the other. | Does stress reduce sleep, or does poor sleep increase stress? |
| Third-variable problem | A different variable may influence both measured variables. | Workload may increase stress and reduce sleep. |
| Bidirectional possibility | Both variables may influence each other. | Poor sleep and stress can feed each other over time. |
Correlation vs Experiment
| Feature | Correlation | Experiment |
|---|---|---|
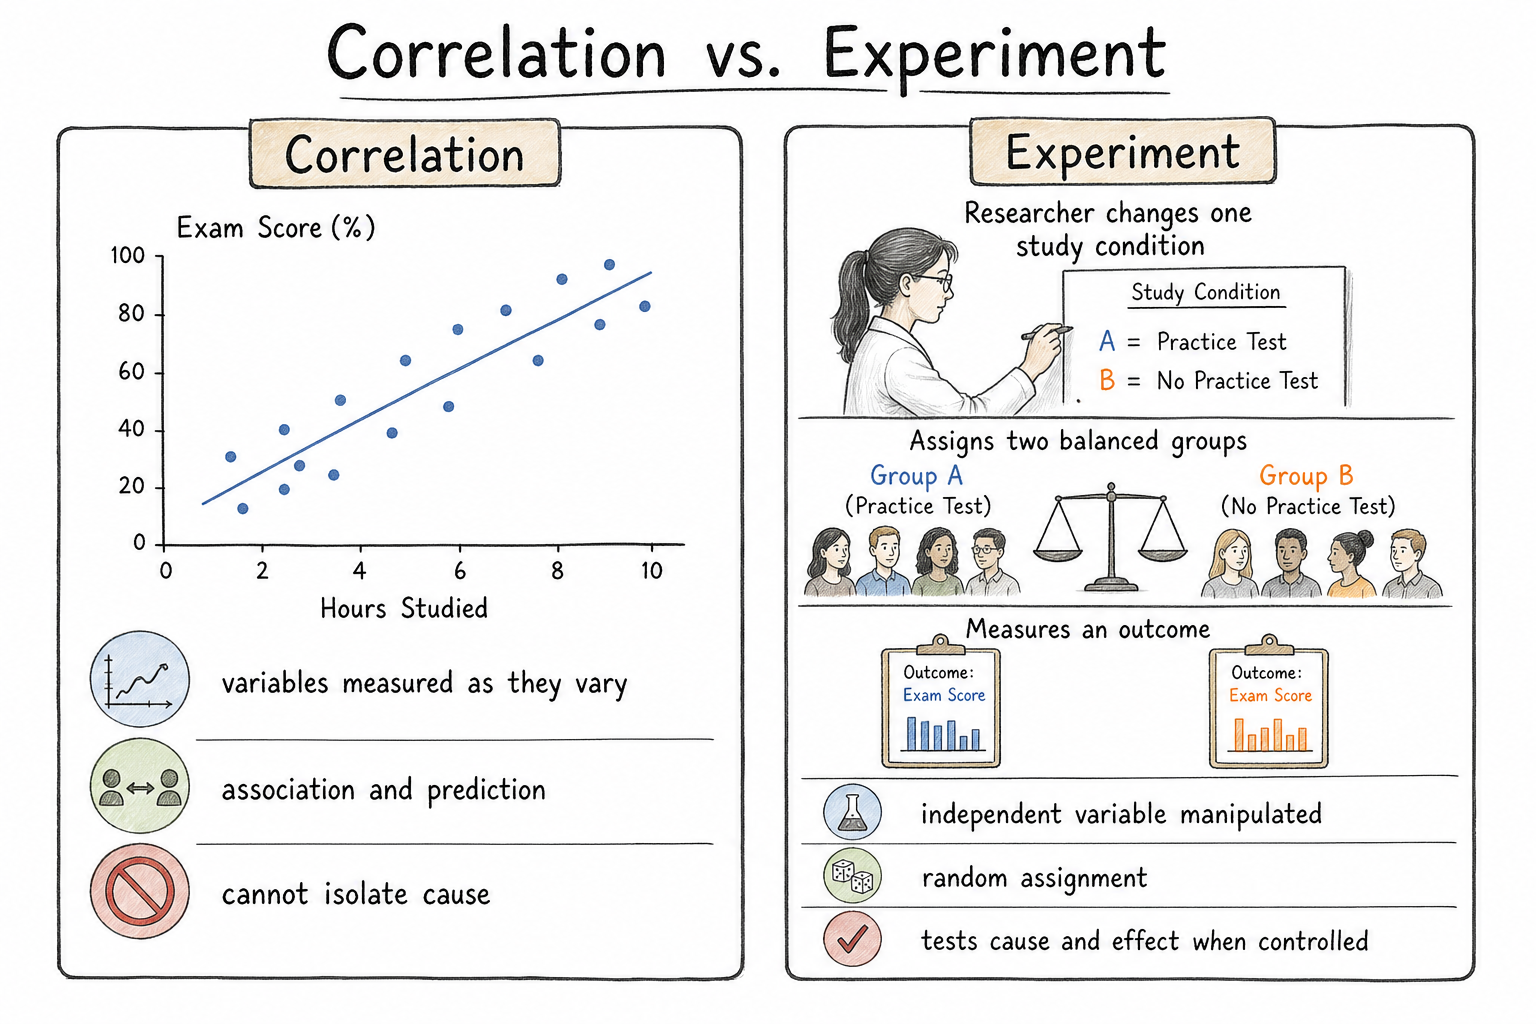
| Variables | Measured as they naturally vary. | Independent variable is manipulated. |
| Assignment | No random assignment to conditions required. | Random assignment often used to balance groups. |
| Main conclusion | Association and prediction. | Cause and effect when well controlled. |
| Main risk | Directionality and third-variable problems. | Confounds if controls fail. |
AP Scenario Decoder
| If the Prompt Mentions... | Think... | Why |
|---|---|---|
| Two measured variables rise together. | Positive correlation. | Same direction. |
| One variable rises as the other falls. | Negative correlation. | Opposite direction. |
| r is close to 0. | Weak or no linear relationship. | Strength is based on distance from zero. |
| Can predict but not prove cause. | Correlation. | No manipulation/control of causal variable. |
| Could A cause B or B cause A? | Directionality problem. | Causal direction is unclear. |
| A third factor might explain both. | Third-variable problem. | Alternative explanation remains. |
Vocabulary
- Correlation: Relationship between two variables.
- Correlation coefficient: Number from -1.00 to +1.00 showing direction and strength.
- Positive correlation: Variables move in the same direction.
- Negative correlation: Variables move in opposite directions.
- Zero correlation: No clear linear relationship.
- Scatterplot: Graph showing paired data points.
- Directionality problem: Cannot tell which variable may cause the other.
- Third-variable problem: Another factor may explain both variables.
- Prediction: Using one variable to estimate another.
Common Traps
- Sign trap: Negative does not mean weak. It means opposite direction.
- Strength trap: Strength depends on distance from zero.
- Causation trap: Correlation does not prove causation.
- Prediction trap: Prediction is allowed, but explanation of cause is not.
- Third-variable trap: Always ask whether another factor could explain both variables.
Quick Check
You are ready when you can read a correlation coefficient, describe a scatterplot, allow prediction, and block causal claims using directionality and third-variable language.