Statistical Analysis Techniques
How do psychologists summarize data, notice patterns, and decide whether findings are likely meaningful?
The Core Idea
Descriptive statistics summarize a data set. Inferential statistics help researchers decide whether sample results are likely to reflect a real pattern beyond the sample.
AP statistics for psychology is about reading results sensibly, not becoming a calculator.
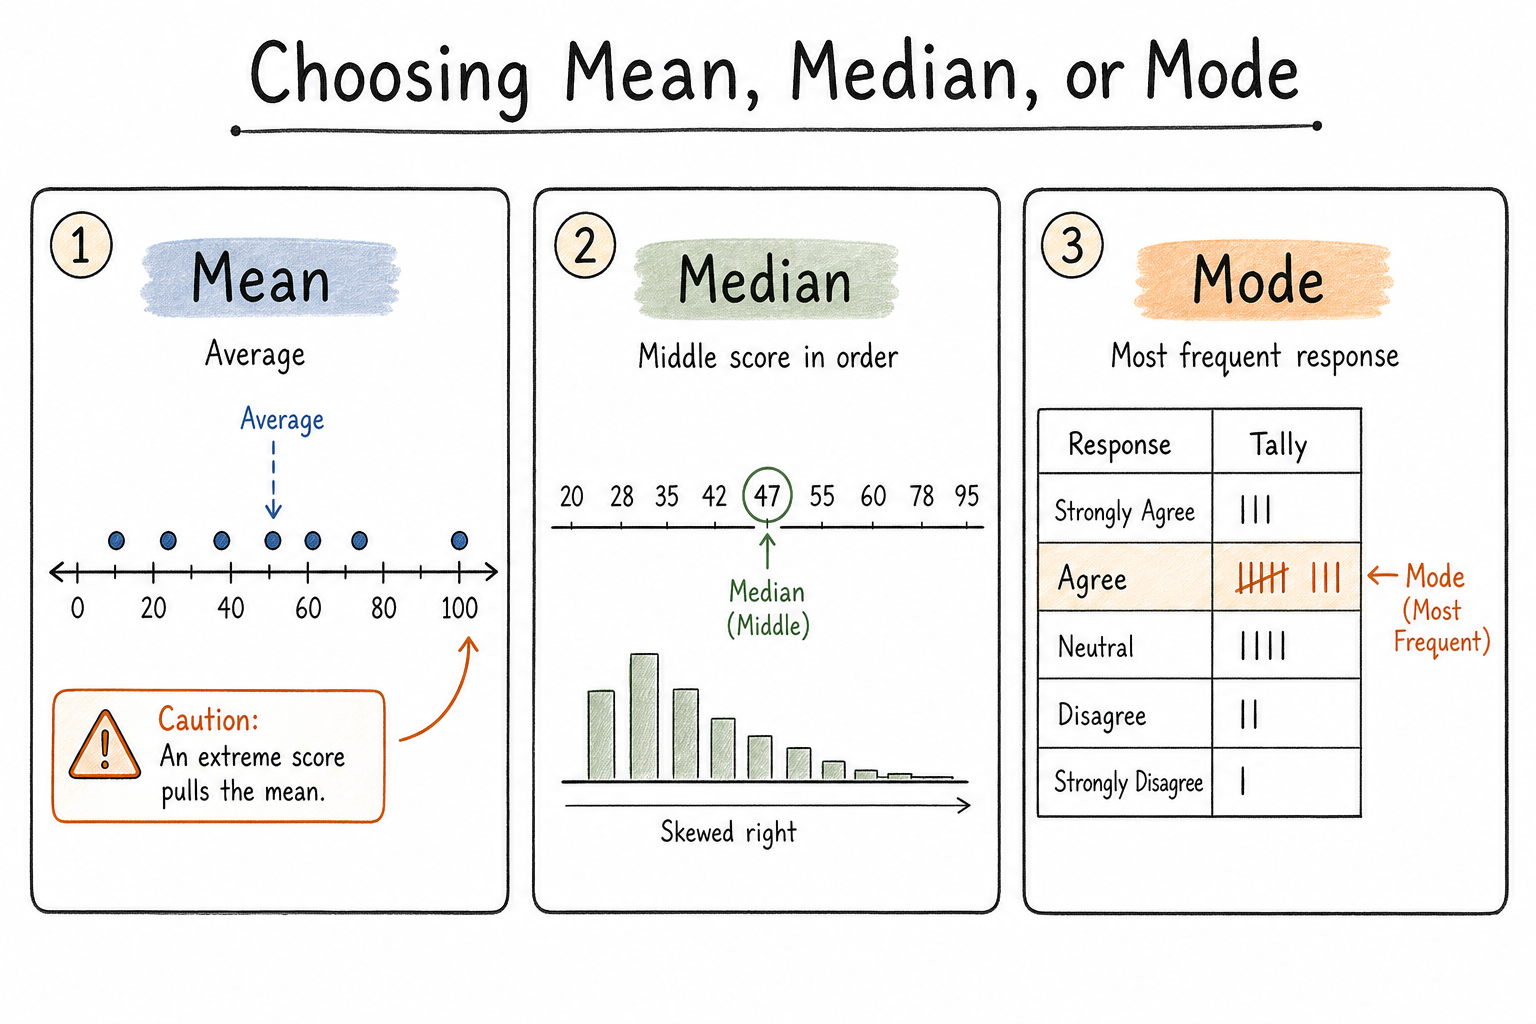
Measures of Center
| Statistic | Meaning | Best When | Watch Out For |
|---|---|---|---|
| Mean | Arithmetic average. | Distribution has no extreme outliers. | Outliers can pull it up or down. |
| Median | Middle score. | Distribution is skewed or has outliers. | Does not use every value as fully as the mean. |
| Mode | Most frequent score. | Looking for most common category or score. | May be unstable or there may be more than one mode. |
Variation and Spread
Measures of spread tell whether scores are packed together or scattered widely.
| Statistic | Meaning | AP Clue |
|---|---|---|
| Range | Highest score minus lowest score. | Quick spread estimate, sensitive to extremes. |
| Standard deviation | Typical distance of scores from the mean. | Larger standard deviation means scores vary more. |
| Low variability | Scores cluster close together. | Performance is consistent. |
| High variability | Scores are spread out. | Participants differ more. |
Distribution Shape
| Shape | Meaning | Interpretation Move |
|---|---|---|
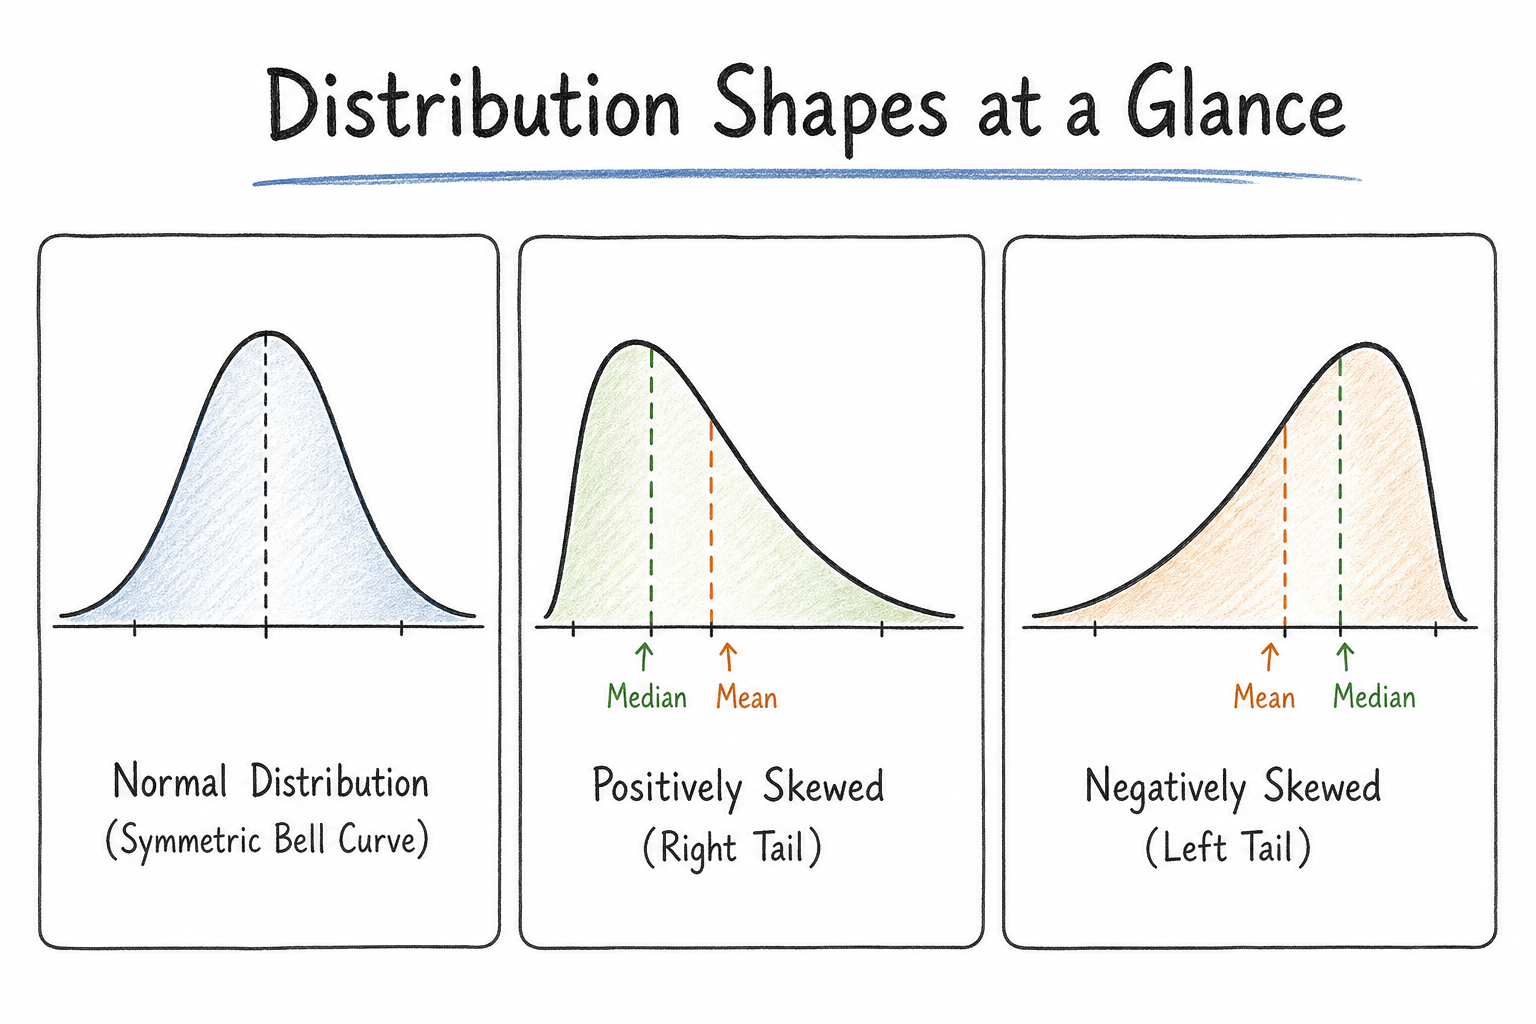
| Normal curve | Bell-shaped distribution with most scores near the mean. | Mean, median, and mode are usually close. |
| Positive skew | Tail stretches toward high scores. | Mean may be pulled above median. |
| Negative skew | Tail stretches toward low scores. | Mean may be pulled below median. |
| Outlier | Extreme score far from the rest. | Can distort mean and range. |
Data Displays
Graphs should help you compare groups, spot patterns, and notice misleading scale choices.
| Display | Best For | AP Warning |
|---|---|---|
| Bar graph | Comparing categories or group means. | Check axis scale before judging size of difference. |
| Histogram | Showing distribution of scores. | Look for skew, spread, and clusters. |
| Line graph | Showing change over time. | Time points should be meaningful and ordered. |
| Scatterplot | Showing relationship between two variables. | Correlation does not prove causation. |
Inferential Statistics
Inferential statistics help researchers decide whether a sample finding is likely to represent a real pattern rather than random chance.
| Concept | Meaning | AP Clue |
|---|---|---|
| Sample size | Number of participants or observations. | Larger samples often give more stable estimates. |
| Effect size | Size or importance of a difference or relationship. | A tiny difference can be statistically significant but not practically large. |
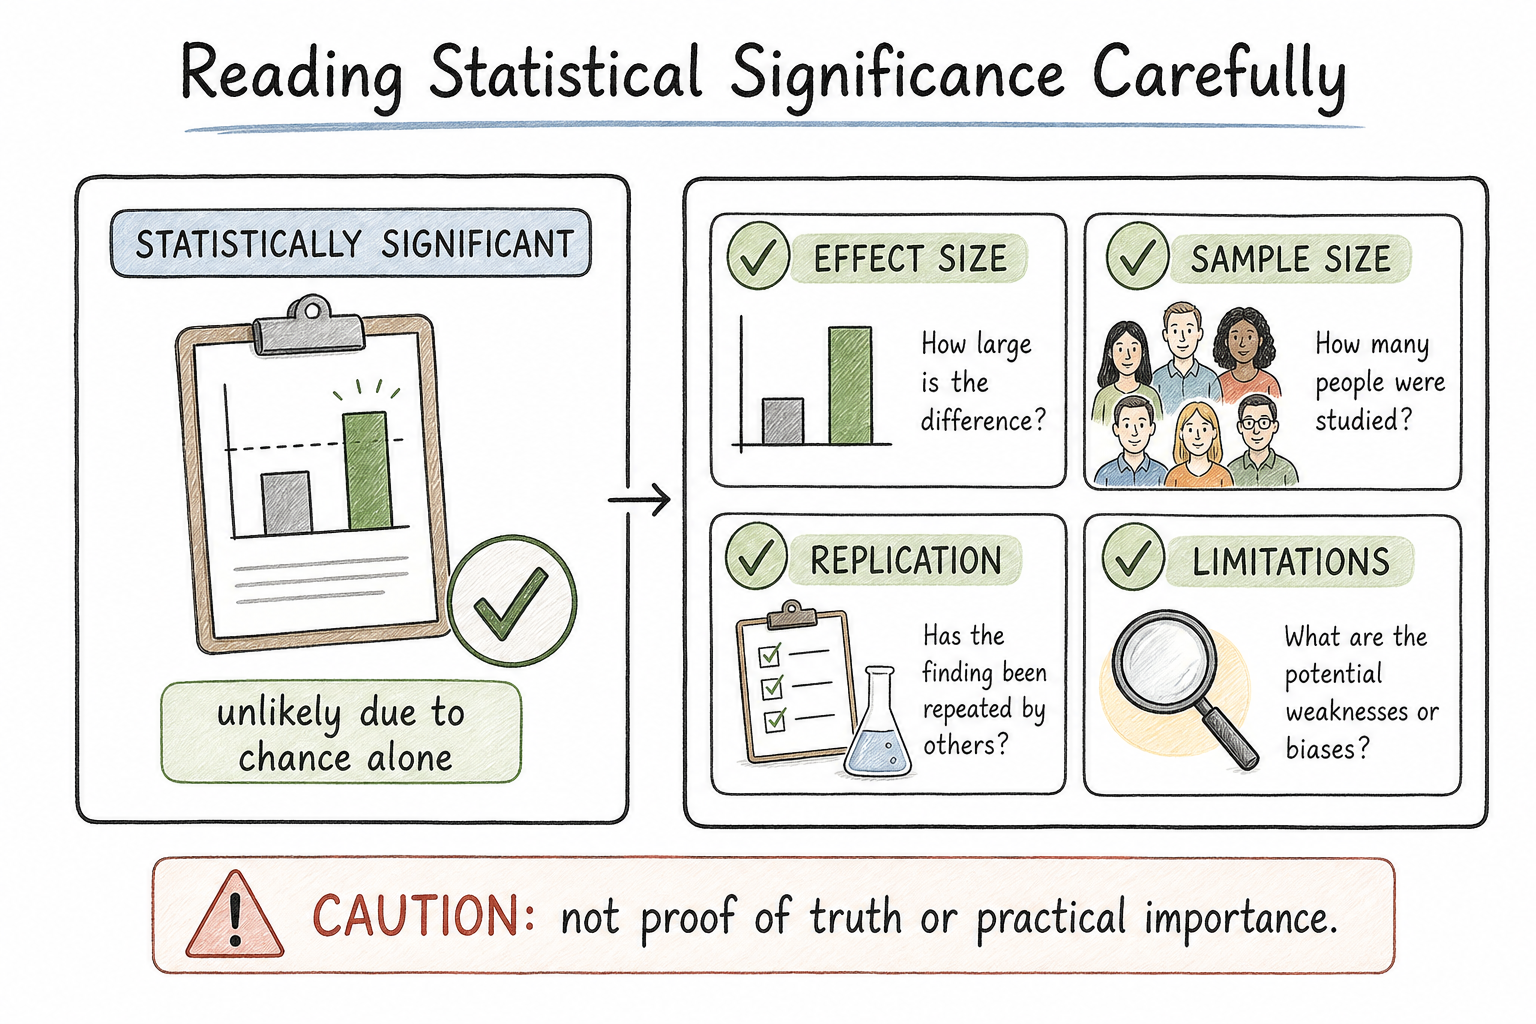
| Statistical significance | Finding is unlikely to be due to chance under the test assumptions. | Researchers reject chance as the best explanation. |
| Practical significance | Finding matters in a real-world way. | Difference is meaningful enough to care about. |
Significance and Error
A statistically significant result is not a guarantee of truth. It is a probability-based judgment. Good interpretation still considers method, sample, effect size, replication, and limitations.
| Result Statement | Careful Interpretation | Bad Overclaim |
|---|---|---|
| The difference was statistically significant. | The finding is unlikely to be due to chance alone. | The hypothesis is permanently proven. |
| The result was not statistically significant. | The study did not find strong evidence of a real difference. | There is definitely no effect. |
| The effect was small. | The difference may be real but limited in size. | Small always means useless. |
| The sample was tiny. | Estimate may be unstable and needs caution. | The study is automatically worthless. |
AP Scenario Decoder
| If the Prompt Mentions... | Think... | Why |
|---|---|---|
| Extreme score pulls the average. | Mean/outlier issue. | Mean is sensitive to extremes. |
| Middle score is better for skewed data. | Median. | Median resists outliers. |
| Scores are more spread out. | Higher standard deviation. | Greater variability. |
| Bell-shaped distribution. | Normal curve. | Most scores cluster near the mean. |
| Finding unlikely due to chance. | Statistical significance. | Inferential conclusion. |
| Axis exaggerates difference. | Misleading graph scale. | Visual display can distort interpretation. |
Vocabulary
- Descriptive statistics: Numbers that summarize data.
- Inferential statistics: Tools for judging whether sample results likely reflect a broader pattern.
- Mean: Arithmetic average.
- Median: Middle score.
- Mode: Most frequent score.
- Range: Highest minus lowest score.
- Standard deviation: Typical distance from the mean.
- Normal curve: Bell-shaped distribution.
- Skew: Distribution with a tail toward one side.
- Outlier: Extreme score.
- Statistical significance: Finding unlikely due to chance alone.
- Effect size: Size of a difference or relationship.
Common Traps
- Mean/median trap: Use median when outliers or skew distort the mean.
- Standard deviation trap: Larger standard deviation means more spread, not a higher average.
- Significance trap: Statistical significance does not prove truth or practical importance.
- Graph trap: Axis scale can exaggerate or hide differences.
- Sample trap: A larger sample often helps stability, but representativeness still matters.
Quick Check
You are ready when you can choose the best measure of center, interpret spread and skew, read a graph carefully, and explain statistical significance without overclaiming.